Category: Solr

Next Stop Debuggersville!
Recently I was puzzled by some behavior Solr was showing me. I scratched my head and called over a colleague. We couldnt quite figure out what was going on. Well Solr is open source so… next stop – Debuggersville!
Running Solr in the Eclipse debugger isn’t hard, but there are many scattered user group posts and blog articles that you’ll need to manually tie together into a coherent picture. So let me do you the favor of tying all of that info together for you here.
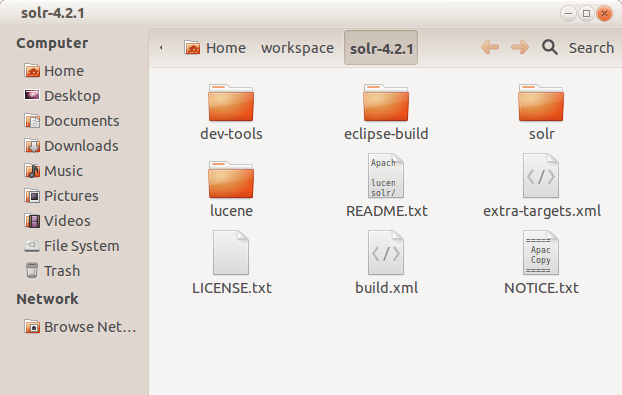
First step is of course to grab the source code for the version of Solr you want to debug. Unpack this somewhere, and browse to the top directory. Let’s get comfortable with the directory structure. Most importantly, I want to point out these three pieces:
- build.xml – top level Solr/Lucene ant build.xml file
- lucene/ – directory containing Lucene’s source
- solr/ – directory containing Solr’s source
The takeaway here is that it’s important to note that Solr and Lucene are deployed together. This has a lot of conveniences, but is a bit confusing. We think we just downloaded Solr, but really we have Solr and Lucene bundled together. To help keep things clear, I’m going to call the whole shebang we just downloaded the Solr/Lucene source tree and I’ll call the solr/ subdirectory the Solr source tree.
My Solr/Lucene Source Tree
OK enough nonsense, let’s get started. Browse to the top-level Solr/Lucene source tree in your command line and lets bootstrap the Solr/Lucene Eclipse project.
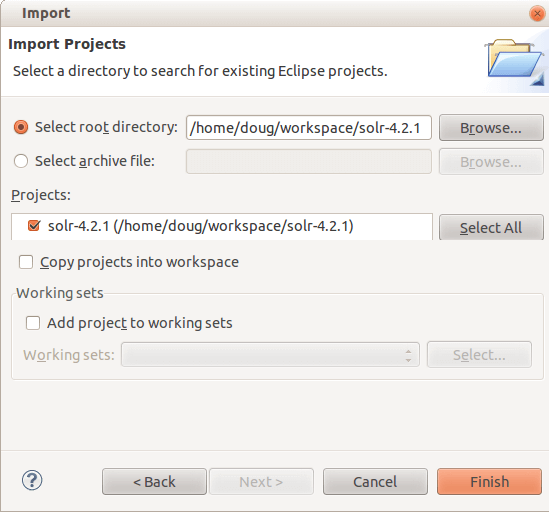
~/workspace/solr-4.2.1$ ant eclipseOnce this completes, load up Eclipse, and select File -> Import. Select Existing Eclipse Project from the dialog and browse to the top of your Solr/Lucene source tree. Once this directory is selected, click “Finish”. Now you have an Eclipse project with both Solr and Lucene.
Import Solr/Lucene Into Eclipse
Now back to the command prompt, we’ll go into the Solr source tree and build the example/ directory that holds the Solr/Jetty web application. The same example/ directory distributed with Solr`s binaries.
~/workspace/solr-4.2.1$ cd solr/~/workspace/solr-4.2.1/solr$ ant exampleOnce the example app has been built, we can cd into the example directory, and use start.jar in the same way we would with the binary distribution of Solr. We can still include the usual solr arguments for items such as changing solr.home, etc. The only difference here is we’re going add Java arguments needed for debugging.
~/workspace/solr-4.2.1/solr$ cd example~/workspace/solr-4.2.1/solr/example$ java -jar -Xdebug \ -Xrunjdwp:transport=dt_socket,server=y,suspend=y,address=1044 \ start.jarBecause we set suspend=y, Java is waiting for us to attach our debugger before beginning execution. Switch back to Eclipse. Right click on your Solr/Lucene Java project and select Debug As and then Debug Configurations. Under the Remote Java Application category. Click New to create a new debug configuration. Enter in the port we just specified to Java at the command line – 1044. Hit Apply and Debug. Over in the command line you should see Solr starting up.
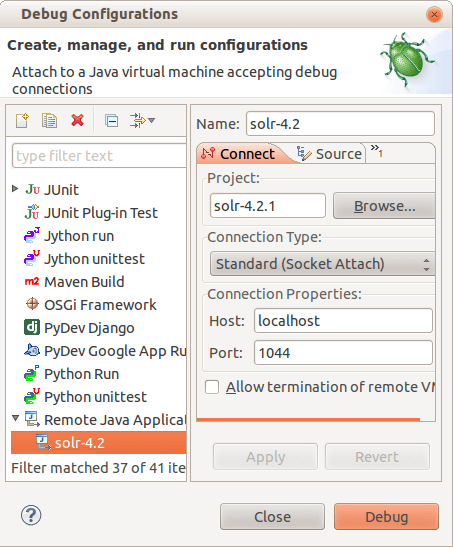
Debug Config For Attaching to Example Web App
Huzzah! Youve done it! You should now be able to set breakpoints throughout the Solr/Lucene code base, step through code, and do all the other fun stuff you can do with any other hunk of source code. In the future, you can simply recall this debug configuration in the “Debug As” menu and Eclipse will attempt to attach to any Solr instance launched with Javas debug commands. Have fun hacking on Solr!