
 Matthias Krueger
Category: Relevancy
Summary
With Google Analytics Universal Analytics (UA) reaching end-of-life, businesses must migrate to Google Analytics 4 (GA4). Unlike UA’s built-in Site Search tracking report, GA4 offers limited search reporting capabilities despite retaining basic search event tracking. To replicate UA’s functionality, the blog outlines a solution using GA4’s BigQuery export and Google Looker Studio. The approach involves enabling GA4 search tracking, exporting raw event data to BigQuery, creating custom SQL queries to calculate search metrics (sessions with search, unique searches, exit rates, refinements), and building interactive dashboards in Looker Studio to visualize site search performance data.
Introduction
As the end-of-life for Google Analytics Universal Analytics (UA) is nearing, businesses face the challenge of migrating to Google Analytics 4 (GA4). As you probably have learned this is not a small update. GA4 is built upon a different platform and some of the features of UA are not readily available after the transition. One of these features is the Site Search tracking report which in UA provided some basic functionality to monitor on-site search activities. In this post we outline the changes GA4 brings and describe basic steps for implementing a similar report using GA4, BigQuery and Google Looker Studio.
Site Search Tracking and Reporting in Universal Analytics
The old Google Analytics UA had some features especially tailored to tracking on-site search behavior:
- Searches could be tracked by enabling the built-in “Site Search Tracking” which allowed to capture searches from the URLs of page views.
- When Site Search Tracking was enabled UA started populating dimensions and metrics related to on-site search which could be used within UA or in any dashboarding tool supporting UA as a data source. These dimensions included the search keyword, a possible keyword refinement, the page the search was started from etc. Metrics include the number of (unique) searches, the number of sessions with at least one search, the number of search refinements and exits etc.
- The UA user interface included the Site Search report (under Reports > Behavior > Site Search) which provided information about the search activity on your site over time. The report allowed drill-down based on the search-related dimensions but also leveraged the general user segment drill-down of UA.
While this built-in search tracking in UA was far from perfect (relying on page views made it awkward to integrate with mobile apps, essential metrics such as number of search results were missing, it lacked any meaningful click-tracking, and it wasn’t well integrated into e-commerce tracking tracking), it was often a first step to gain any insight into your user’s on-site search behavior.
Site Search Tracking and Reporting in Google Analytics 4
The new GA4 is based on a new platform which is less web-centric than GA UA and treats your website more as an application that has events happening, and less as a set of pages.
While GA4 has retained some built-in functionality to track events for on-site searches, there are (except for the “search term”) no search-specific dimensions populated or metrics calculated. Consequently, there are no dashboards or reports specifically related to on-site search available in the GA4 user interface. While this is quite a limitation, GA4 also brings positive changes. GA4 now, for example, offers raw event data exports to BigQuery which previously was only available for customers of the costly Google Analytics 360 offering.
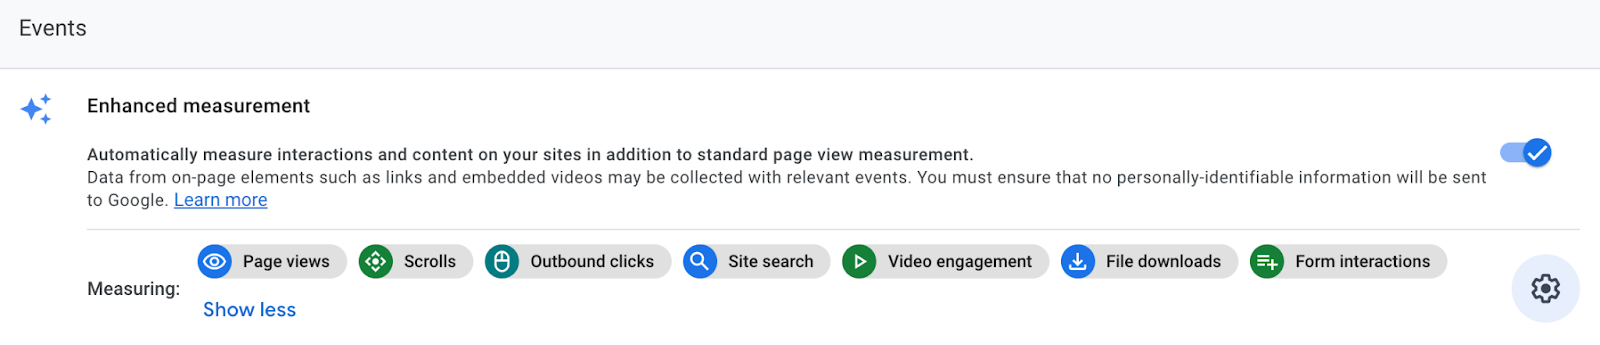
Tracking site on-site searches in GA4 is an opt-in feature which is enabled similarly to Universal Analytics.
- Enable Enhanced Measurement for the Data Stream (your website) you want to track on-site searches on.
- Configure the URL query parameter(s) which trigger Site Search events from in the configuration of Enhanced Measurement. For our search result page https://opensourceconnections.com/?s=help we would configure the parameter name s.

Once enabled, GA4 tracks searches with view_search_results events. Alternatively, if your site does not use URL parameters to store the search term or you want to track searches from an app, you can directly send the view_search_results events using GA4’s tracking mechanisms:
- The Google tag (gtag.js) for JavaScript based tracking within your website.
- Google Tag Manager if you already have that in place.
- The Google Analytics for Firebase SDK for mobile app tracking.
When view_search_results tracking is successfully set up, you can see these events arriving with their metadata by looking at the generic Engagement > Events dashboard in GA4.

Additionally, you can explore Search Term usage in the Explore section of GA4.

To generate further insights additional tooling is needed.
GA4 Site Search Reports using BigQuery and Looker Studio
We have set up tracking for on-site searches successfully but learned that the built-in reporting in GA4 is limited. In the following sections we outline an approach where we use the GA4 export to BigQuery and the BigQuery integration in Google Looker Studio to generate a dashboard which replicates some of the reports previously available in the Site Search report of Universal Analytics.
Connecting GA4 to BigQuery
BigQuery is Google’s fully managed, serverless data warehouse. It supports efficient querying of large volumes of structured hierarchical data using SQL. GA4 can export raw event data to BigQuery enabling a very flexible platform to build reports.
The steps to enable the export from GA4 to BigQuery are described in the GA4 documentation and out of the scope of this post. There is a free daily export of the previous day’s data and a non-free streaming export, making data more immediately available in BigQuery.
BigQuery stores the data in projects which contain datasets which consist of tables. Usually you would create one project for all your analytics data and the GA4 export will create a dataset analytics_<your-ga4-property-id> and for each day one table prefixed with events_ within that dataset containing the tracking data of that day.

Once events have arrived you can query the data in the BigQuery UI. Navigate to the dataset containing the GA4 event export and explore the data using
SELECT * FROM `<project-id>.<dataset-id>.events_<date>`
and replacing the project-id, dataset-id and date placeholders with your respective values. The GA4 export schema reference contains helpful information about all fields.
Calculating Site Search Metrics
We want to replicate some of the Site Search report metrics from the old Universal Analytics Search dashboard. Fortunately, Google has revealed how these metrics are calculated in UA. For this post we reproduce the following metrics in GA4:
- Sessions with Search = The number of sessions that used your site’s search function at least once
- Percentage of sessions that used internal search = Sessions with Search / Total Sessions.
- Total Unique Searches = The total number of times your site search was used. This excludes multiple searches on the same keyword during the same session.
- Results Pageviews / Search = Pageviews of search result pages / Total Unique Searches.
- Search Exits = The number of searches made immediately before leaving the site.
- Percentage of Search Exits = Search Exits / Total Unique Searches
- Search Refinements = The number of times a user searched again immediately after performing a search.
- Percentage Search Refinements = The percentage of searches that resulted in a search refinement. Calculated as Search Refinements / Pageviews of search result pages.
- Search Depth = The number of pages viewed after performing a search. This is calculated as Sum of all search_depth across all searches / (search_transitions + 1)
We visualize these metrics in Google Looker Studio (the product formerly known as Google Data Studio and not to be confused with Google Looker, Google’s more advanced data exploration platform). Looker Studio comes with a BigQuery connector and contains a powerful UI to create charts by dragging and dropping fields and defining aggregations. It does not store data itself and is thus limited when it comes to defining more advanced aggregations so we will not use the raw data from Looker directly but define a custom query to aggregate and pre-calculate the information we need.
Please note that this approach aggregates data from BigQuery for every request made from Looker (which can be many considering that dashboards are interactive). This is prohibitively expensive (and slow) for larger datasets. A better approach is to regularly pre-aggregate the daily GA4 into a partitioned table using BigQuery Scheduled Queries.
We use the following query to select only the information we need and pre-calculate some of the metrics we need in our Looker Dashboard:
WITH ga4_search_data AS(
 SELECT
   event_date,
   -- The ga_session_id is only unique per user, so we need to concatenate the two
   -- to generate a globally unique session ID
   CONCAT(user_pseudo_id, "#", (SELECT value.int_value from UNNEST(event_params) where key = 'ga_session_id')) AS unique_session_id,
   event_timestamp,
   event_name,
   (SELECT value.string_value from UNNEST(event_params) where key = 'search_term') AS search_term,
   -- Window function to count all page views in a session after this event
   COALESCE(
     SUM(IF(event_name = 'page_view', 1, 0)) OVER (
         PARTITION BY CONCAT(user_pseudo_id, "#", (SELECT value.int_value from UNNEST(event_params) where key = 'ga_session_id'))
         ORDER BY event_timestamp, event_name
         ROWS BETWEEN 1 FOLLOWING AND UNBOUNDED FOLLOWING
     ), 0
   ) AS subsequent_pageviews
 -- Replace <project> and <dataset> with your project id and dataset id
 FROM `<project>.<dataset>.events_*`
 WHERE
   -- Parameters DS_START_DATE and DS_END_DATE are replaced by Looker Studio
   (_TABLE_SUFFIX BETWEEN @DS_START_DATE AND @DS_END_DATE) AND
   (event_name = 'page_view' OR event_name='view_search_results')
 ORDER BY 2, 3
)


SELECT
 event_date,
 event_timestamp,
 unique_session_id,
 search_term,
 -- Add the previous search_term as the refined search
 LAG(search_term) OVER (
     PARTITION BY unique_session_id, event_name ORDER BY event_timestamp, event_name
 ) AS search_term_refined,
 -- Subtract the followup pageviews of the next search event to count every
 -- subsequent pageview only once
 COALESCE(
   subsequent_pageviews - LEAD(subsequent_pageviews) OVER (
       PARTITION BY unique_session_id, event_name ORDER BY event_timestamp, event_name
   ),
   subsequent_pageviews
 ) AS pageviews_after_search
FROM
 ga4_search_data
WHERE
 -- Only export search events to our dashboard
 event_name = "view_search_results"
ORDER BY
 1, 3, 2
The data prepared for our dashboard then looks like this:
| event_date | event_ timestamp | unique_ session_id | search_term | search_term_ refined | pageviews_ after_search | Comment |
|---|---|---|---|---|---|---|
| 20230216 | 1676543… | … | laptop | 2 | Initial search with 2 page views after the search | |
| 20230216 | 1676543… | … | notebook | laptop | 1 | Search with changed term (from laptop to notebook) |
| 20230216 | 1676543… | … | notebook 16″ | notebook | 3 | Search term changed to notebook 16” |
| 20230216 | 1676544… | … | notebook 16″ | notebook 16″ | 1 | Searched again with same search term (could be filters or sorting changed) |
| 20230216 | 1676544… | … | notebook 16″ | notebook 16″ | 4 | Searched again with same search term (could be filters or sorting changed) |
Creating a Dashboard in Looker Studio
In Looker Studio create a new Blank report and select BigQuery as the data source. Use the “Custom Query” option and navigate to your GA4 project. Use the query from the previous section and replace the <project> and <dataset> placeholders with the ones of your GA4 export. Check the “Enable date range parameters” box. You can then build your dashboard by adding various charts and adding aggregations over your fields.
Adding Custom Fields
Before adding the charts we define some custom fields in Looker Studio. Custom fields derive their values from the original fields of your data source applying some query-side function. They are useful if you keep referring to the same aggregation in multiple places.
Session ID with Search Term: Click on the Add a field button in the Data tab and add a custom field Session ID with Search Term which combines the Session ID and the search term and enables us to quickly count the number of unique searches.

Is Refinement: Click on the Add a field button in the Data tab and add a custom field Is Refinement which becomes true if the search event had a previous search term and this is not the same as the current search term.

Adding Charts
We are then prepared to add the Time series charts for the metrics we want to visualize. We simply go to the Insert menu and choose the Time Series chart option to create new charts and drag and drop fields from the Data tab into the chart’s Metric section or use the Metric section’s Add metric button to add a custom computed metric for the chart.
Sessions with Search: This is the distinct count of the unique session IDs, so we use the unique_session_id field and apply the Count Distinct aggregation.
 |  |
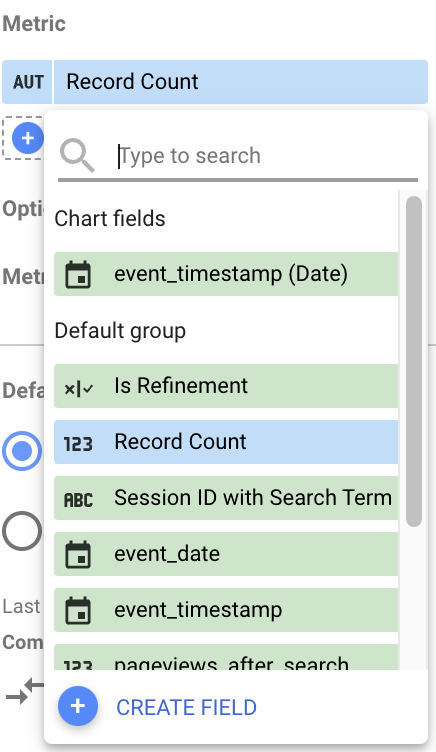
All Searches: As we’re only reading search events from BigQuery this is simply the built-in Record Count metric.
 |  |
Unique Searches: The Unique Searches are the number of distinct session + search term combinations, so we can use our calculated Session ID with Search Term and apply the Count Distinct aggregation.
 |  |
Pageviews / Search: This is the number of pageviews after searches divided by the number of unique searches.
 |  |
Search Exit Rate: The search exit rate is the rate of all searches with no subsequent pageview over all unique searches.
 |  |
Search Refinement Rate: The refinement rate is simply the number of searches we have classified as refinement (had a previous search which did not have the same search term) divided by the number of all events (as we only read search events from BigQuery).
 |  |
The final dashboard
In addition to charts, you can also add interactive elements such as a date range filter (Insert > Date range control) or a navigable data table (Insert > Table) to allow your dashboards users to drill down into the data by date or search term. The final dashboard looks like this and is ready to be shared within your search management team.

Summary
We have outlined the sweeping changes the new Google Analytics 4 platform brings for tracking on-site searches and one way to replicate some of the reporting previously available using Google BigQuery and Looker Studio. While this may be a first step to dip your toes into site search tracking with the GA4 platform you will need a more sophisticated approach to track search quality related metrics and ultimately measure the impact of your search performance on your business KPIs.
Please contact us if you need help tracking on-site search (with Google Analytics or any other solution).
Our new training on Search Quality teaches a holistic approach to gain insights from search tracking data.
Image by Foot Vectors by Vecteezy